The Re-Emergence of European East-West Migration – the Austrian Example
-
Author(s):Fassmann, HeinzKohlbacher, JosefReeger, UrsulaPublished in:Central and Eastern European Migration Review, Vol. 3, No. 2, 2014, pp. 39-59Views: 22749
Since the fall of the Iron Curtain 25 years ago, the asymmetric Central European labour market that was cut off by different legal systems gradually disappeared and has now been replaced by a unified migration space, where the costs for migration or pendular mobility and the wage gain which migrants can achieve are the decisive factors in the decision of whether to migrate or not. Official statistics show that, over the past ten years, migration from the new member-states of 2004 and 2007 to the EU15 in general and to Austria – a country directly bordering many of the new EU member-states – in particular, has significantly gained in importance. This new East-West migration is characterised by high qualification, a concentration on employment-relevant age groups and high spatial flexibility. Migrants are moving if wage differentials are significant and employment opportunities are given and they return or move further away if the labour market loses its attractiveness. The new East-West migration can provide gains for the target regions, for the regions of departure and for the migrants themselves.
Introduction
Central and Eastern Europe has undergone enormous political changes which have gone hand-in-hand with the gradual removal of migration-related barriers. Starting with the fall of the Iron Curtain in 1989 after 40 years of substantial constraints in individual mobility, the region saw Austria’s accession to the EU in 1995 and that of ten mostly Eastern European countries in 2004, followed by Romania and Bulgaria in 2007. Both the 2004 and 2007 enlargements went hand-in-hand with the implementation of transitional rules concerning labour-market access on the Austrian side, rules which were finally abolished for the 10 Eastern European member-states in May 2011 and for Romania and Bulgaria by the end of 2013 (cf. Engbersen 2012; Fassmann, Reeger 2012; Okólski 2012a).1
With the removal of substantial legal constraints in individual mobility – the main hypothesis of this article – a push-and-pull-driven migration pattern becomes more and more important (cf. Kahanec, Kureková 2014). The decisive parameters of such an international migration are income differentials on the one hand and migration costs on the other. In other words, proximity between the potential regions of departure of labour or pendular migrants, as well as income differences and employment opportunities, become more important than other factors (see also Parnreiter 2000). The migration space, divided due to international boundaries, and with its several asymmetric labour markets, will gradually be transformed into a unified migration space with symmetric labour markets around the large metropolises. Policy differences between the countries of origin and of destination also appear to be relevant, for example in terms of regulations on businesses and labour markets (Westmore 2014). Cross-country differences in structural economic policies may also explain international migration to some extent (Strzelecki, Wyszynski 2011).
This article focuses on this process and on the emergence of migration driven by push and pull factors. It is divided into four main sections. Firstly we explain the research question, the revisited push and pull model and (problems with) the available data used in the analysis. Secondly, we show the development of inflows, outflows and stocks of migration from the EU8+2 countries to the EU14 in general. In the third section we focus on the case of Austria and look in more detail into the stocks and flows – including some socio-demographic features – from Central and Eastern European countries (CEECs). In a short concluding section we end with an emphasis on the growing importance of intra-European migration and mobility and review our three basic research questions.
Research questions and the theoretical and empirical background
Research questions
We assume that, with the fall of the Iron Curtain, the accessions of 2004 and 2007 and the phasing out of the transitional rules, a push-and-pull-driven migration pattern becomes dominant. The decisive parameters in push-and-pull-driven migration are income differentials (in particular skill-specific wage differentials; see Westmore 2014) on the one hand and migration costs on the other (see, e.g., de Haas 2008; Hagen-Zanker 2008). Migration costs are, furthermore, linked to the distance or proximity of the regions of origin to the potential target regions (Kahanec, Pytliková, Zimmermann 2014). With the ongoing process of the emergence of a legally harmonised and unified migration space, the push and pull factors became more and more important and the legal barriers weaker.
Our first research question examines the increase of international migration across the former Iron Curtain in the last decade. If the hypothesis concerning the importance of the push-and-pull-driven migration pattern is correct and if the large economic differences are still in effect, international migration between the former East and West will increase (see also Borchers, Breustedt 2008; Strzelecki, Wyszynski 2011). It will increase gradually and perhaps contradictory to a converging economic process, as the population starts to identify migration as a project via which to solve their socio-economic problems (Reniers 1999). It is important to note that Strzelecki and Wyszynski (2011) stressed the differences and changes in unemployment rates between countries – important factors for migratory flows, particularly at their later stage. People need time to adapt and to explore, therefore the scale of international migration could increase despite the fact that economic disparities are starting to decrease. The emergence of a legally harmonised and unified European migration space requires time.
Our second research question focuses on the emergence of transnational labour markets. If – once again – the hypothesis is correct that a push-and-pull-driven migration pattern is of considerable relevance (Borchers, Breustedt 2008), and if large economic differences are observable in adjacent regions, those regions will grow together and emerge as functional regions with flows of labour migrants in one direction and capital in the opposite direction. With the emergence of a legally harmonised and unified European migration space, geographical variables became more and more important. Proximity shapes and supports the emergence of transnational labour markets (see Hagen-Zanker 2008; Müller-Mahn 1999). We assume, therefore, that the over-proportional growth of such transnational labour markets is driven by the maximisation of migration gains (wage differentials) and, at the same time, the minimisation of migration costs by split households.
Our final research question focuses on the assumption that, if the push-and-pull-driven labour-migration pattern of our hypothesis does indeed become dominant and legal barriers disappear, then we should see high spatial flexibility and an increase of in- and out-migration. With the decline of barriers, the costs of migration fall. Minor signals from the labour market in potential target regions in terms of wages and labour opportunities are therefore stimulating the realisation of potential migration. We expect to see the dominance of labour migration and a focus on labour-market relevant attributes concerning age and qualification. The young and the well-qualified in the sending population will be the dominant group amongst the new East-West migrants because they react more quickly and are able to find employment outside their country of origin.
The push and pull model, revised on the basis of macro factors
In 1966, Everett Lee published his classic ‘Push and Pull Model,’ based on the general assumption that everybody is a potential migrant, evaluating the economic attractiveness of the place of residence and work and comparing it to other possible contexts in which to earn a living. After evaluating the complexity of economic attractiveness in one region compared to that of another region, perfectly informed and rational people are deciding whether or not to migrate. Historical ties are taken for granted in this approach, as are legal barriers and country-specific migration policies. The individually perceived and expected costs and benefits of migration are the only variables in the model.
In this context the attractiveness itself is the sum of location factors, which can be separated into positive so-called pull (or plus) factors and negative (minus) push factors (see Figure 1). Push factors are those circumstances which make it unattractive for a person to live in a particular place, region or country. These push factors could be high unemployment, low wages or perspectives that do not promise any change in the future. Pull – or positive – factors, in contrast, might be a high income, a favourable job or business opportunity and promising expectations. In this context, Lee emphasises that the perception of pull and push factors is differently defined for every (prospective) migrant, depending on his or her life style and personal circumstances. Lee also states that the decision to migrate is never completely rational and not all persons who migrate reach that decision themselves (Lee 1966: 51). For this reason, amongst others, he warns that factors which hold, attract or repel people are precisely understood neither by social scientists nor by the persons directly affected (Lee 1966: 50).
Whether or not an individual really decides to migrate depends on the balance of push and pull factors at home compared to the push and pull factors anywhere else. The balance in favour of the move must be enough to overcome the natural inertia which always exists (Lee 1966: 51), as well as any intervening obstacles. Obstacles can include distance and related transportation costs or the legal frameworks governing migration which may hinder migration or make it very costly. Finally, there are also personal factors which affect individual thresholds and facilitate or delay migration. In this connection, Lee emphasises that it is not the actual factors at origin and destination, but rather the perception of these factors, which results in migration.
In the original literature, the push and pull model is a concept which describes individual decision-making processes at a micro level. However, assuming that the principal idea of the push and pull model is valid – the balancing of push and pull factors at home compared to the push and pull factors anywhere else, followed by the decision to migrate or to stay – then the model can be transferred to the macro level of regions or countries. The migration from one region to the other will be directly proportional to differences in attractiveness (labour-market-related factors like wages and unemployment, for example, and welfare and social benefits) and indirectly proportional to constraints on migration, such as distance, transportation costs and political barriers in particular.
Figure 1. Push and pull factors and constraints to migration – an illustration
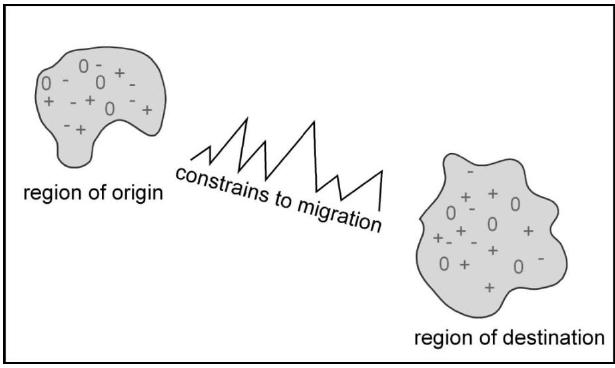
Source: Fassmann (2011) based on Lee (1966): 51.
Most models at the macro level refer to two main macro-economic variables that affect the migration decision: wage differences and employment opportunities (Pytliková 2006: 78). In aggregate terms, the differentials in wages and the probability of being unemployed are typically proxied by GDP per capita levels in destination and source countries in combination with (un)employment rates. Migration stocks and, thus, established networks, usually foster migratory movements in reducing migration costs and in steering the direction of migration flows by perpetuating them (Bauer, Zimmermann 1999). Finally the distance from the origin to the destination country shows a statistically significant negative influence on migration flows, supporting the theoretical considerations of the costs and risks of movement on the migration decision (Fields 1991). Recently this was confirmed by Kahanec et al. (2014: 20), who emphasised that, in addition to mere geographical distance, linguistic proximity is also significantly associated with stronger emigration flows. Despite some justified criticism of the model (Müller-Mahn 1999; Parnreiter 2000; Zolberg 1989) and debate about whether or not it is flexible enough to enable analysis of the complex interactions between migration factors, it is still relevant from our perspective. This position was confirmed by Borchers and Breustedt (2008: 16) who worked out the relevance of the model for migration projections and potentials. They proposed an extended push and pull model, taking into account a multitude of factors and making the model more meaningful. Braun and Topan (1998), in particular, emphasised that a diversification of the factors in sending and receiving regions would be necessary. Strzelecki and Wyszynski (2011) have strongly argued for a more distinctive analysis of the relevant push and pull factors of Polish migration, but this does not mean that the model as such has become obsolete (see also Westmore 2014) as a basis for empirical analysis.
Data situation
For the following analysis on migrant stocks in and flows to Austria we rely on data from the Austrian Population Register (on an annual basis) and from the register-based census. Generally it has to be acknowledged that official statistics may fail to give a ‘complete picture’ in this respect, as they do not provide information, for example, on duration of stay or migration motives. Furthermore, some migrants either do not register (as they do not intend to stay for a longer period of time or even commute on a daily basis from neighbouring countries) or they deregister upon leaving again, as there are virtually no negative consequences for them and they are thus not depicted in official data. However, the population register is well elaborated and functional. Living in Austria for a longer period of time without being captured in the register is highly unlikely.
We should also point out that statistics are often quite slow to accurately reflect what is happening and it may take a long time for data to be available. This time lag has also proven to be a problem for this article. For some aspects the data are quite up-to-date – e.g. for numbers up until 2013; on the other hand, flow data are only available until 2013, so nothing can be said about the effect of the end of the transitional rules for Romania and Bulgaria at the end of that year.
The time-lag problem also applies to the data which we use for the analysis of migration from EU8 and EU2 countries to the EU15 in general. We sourced data on the population in the EU15 by countries of origin and destination from Eurostat, which relies on member-states sending in their national data. This is a principal issue when using Eurostat data – they are just as valid and reliable as national statistics. Eurostat has neither the potential nor the official mandate to collect data on their own. Migration data pose problems, in particular, of comparability (different concepts and definitions) and availability (cf. Fassmann, Reeger, Sievers 2009).
East-West migration in general (2002–2012): CEE citizens in the EU15
With the accession to the EU of the most important countries of origin of traditional East-West migration in 2004 and 2007, a common European migration space was created for the first time. However, this new freedom of movement was not accompanied by a freedom to work and so, in most Western EU countries, free access to the labour market did not immediately exist for citizens of these ‘new’ EU countries. Germany and Austria, in particular, both sharing borders with some of the accession states, kept their labour markets closed for citizens of new EU countries until 1 May 2011 (2013 for Romania and Bulgaria). However, in factual terms, the transitional rules did not limit the freedom of settlement as such. As a result, it has become possible for citizens of the new EU states to move to any other member-state as students or retirees or to join family members. They also have the right to establish businesses in any EU member-state and thus to work in a self-employed capacity (cf. Engbersen 2012; Fassmann, Reeger 2012; Okólski 2012b).
CEE migrants by country of origin
Since the EU enlargement of 2004, the size – as well as the structure – of the immigrant population from CEECs has changed noticeably in the EU15. Before 1 May 2004, there were fewer than 1.2 million CEE citizens legally residing there. However, this figure did not include any current data for France, Greece, Ireland and Luxembourg. If these countries are included, the estimated number in 2003 rises to approximately 1.5 million CEE citizens. In Western Europe, the share of immigrants from CEECs was thus slightly below 7 per cent of all foreign residents officially living in the EU15.
By 2007, however, the number of CEE citizens in the EU15 had more than doubled to just over 2.6 million (see Table 1). Again, this figure contains no data for France, Greece, Ireland and Luxembourg; however, if estimates for these countries are included, the number was around 2.9 million in 2007. The increase was therefore more than 100 per cent within four years. This contradicted the popular expectation that East-West migration within the EU could actually be prevented through restrictive transitional regulations. As most EU15 countries had been granting CEE citizens access to their labour markets since 2006–2007, this rate of increase has continued.
Table 1. CEE citizens in selected EU15 countries by country of origin in 2003–2011 (absolute numbers)
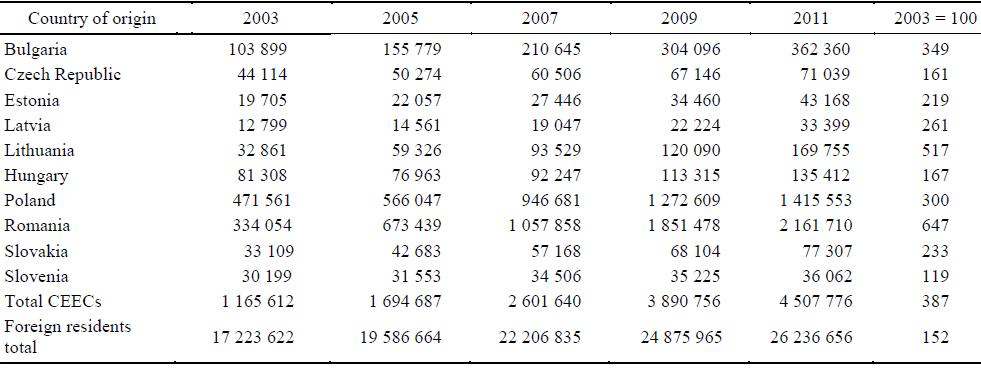
Note: Information on the number of foreign residents from CEECs not (completely for all years) available for France, Greece, Ireland and Luxembourg, these countries have been excluded from the present analysis; data for Belgium, Portugal and the UK have partly been extrapolated. UK data only include Lithuania, Poland and Romania.
Source: Eurostat; own calculations.
By the end of the observation period (2011), the number of CEE citizens in the EU15 had again risen sharply, despite the fact that some economic indicators showed a tendency towards convergence. By 2011, 4.5 million East-West migrants resided in Western European countries; their number has grown almost fourfold since 2003. If we once again include estimates for France, Greece, Ireland and Luxembourg, the figure stands at about 4.8 million people. In 2003, the share of immigrants from CEECs in the EU15 countries under consideration amounted to 7 per cent, growing steadily to 11.7 per cent in 2007, 15.6 per cent in 2009 and finally 17.2 per cent in 2011.2
For the whole period, immigration into the EU15 was primarily from Poland, Romania and Bulgaria. In general, these three countries are characterised by lower income levels than some other new EU-member states, and there had, in fact, already been significant emigration from them over the previous 15 years. In contrast, no significant rise in emigration occurred from the Czech Republic, Hungary (until 2007) and Slovenia following EU accession. On the contrary, immediately after 2004 the number of Hungarian citizens in the EU15 decreased, whereas that of Slovenian citizens remained about the same. At the same time, these three countries increasingly became destination countries for immigration from other EU, as well as third, countries. After 2007 this situation changed: Hungary became a main ‘exporting’ country for migrants due to its disastrous economic performance, rising unemployment and real costs of income.
CEE migrants by country of destination
The migrants from CEECs were, however, not evenly distributed throughout the EU15 (without France, Greece, Ireland and Luxembourg due to the unavailability of data). In 2007 the largest group resided in Spain (767 700), followed by the UK (386 000 Lithuanians, Poles and Romanians only, unofficially 700 000), Germany (682 800) and Italy (456 300). The vast majority of all CEE migrants were registered in these four countries, with Spain and Italy only recently having become significant destination countries for migrants from CEECs. By 2011, the general distribution had not much changed, though the growth was considerable in some countries. Generally speaking, it is important to note that Austria and Germany display the lowest growth rates, demonstrating the effectiveness of the transition rules on the one hand and the high proportion of CEE citizens in the starting year 2003 already living in Germany and Austria on the other. Italy and Spain are amongst the countries with the strongest growth, both with more than one million migrants from CEECs in 2011.
The highest immigrant increase from CEECs can be found in Portugal (though from a low level), Spain, the UK and Italy (see Table 2). In contrast, Germany – up to the 1990s, still the most important destination for European East-West migration – recorded a decline in legal foreign residents from CEECs until 2006. This was partly due to high unemployment and partly to the restrictive transitional regime and a stricter control system. In the Scandinavian countries of Finland, Denmark and Sweden the increase was comparatively lower. This is quite surprising for Sweden, as free access to the labour market was immediately possible there up to 2005. In Austria, applying the restrictive transitional regime, the increase between 2003 and 2011 amounted to 91 per cent.
Table 2. CEE citizens in selected EU15 countries by destination country in 2003–2011 (absolute numbers)
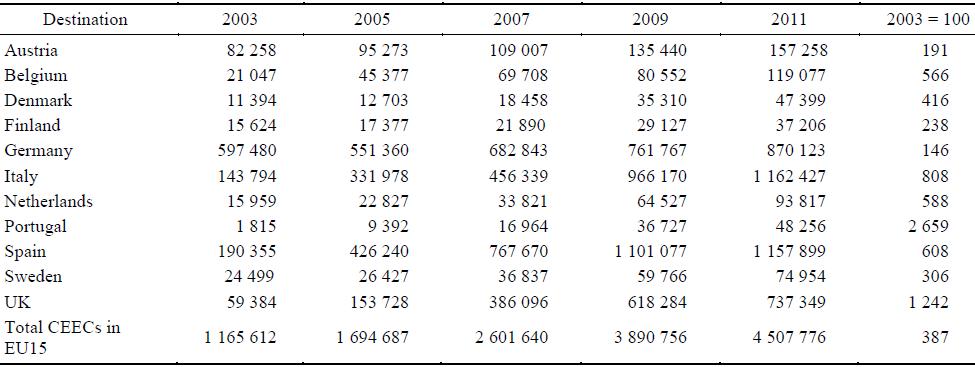
Note: Information on the number of foreign residents from CEECs not (completely for all years) available for France, Greece, Ireland and Luxembourg; data for Belgium, Portugal and the UK have partly been extrapolated. UK data only include Lithuania, Poland and Romania.
Source: Eurostat; own calculations.
For the whole observation period we can assume that the CEE migration to EU15 countries was largely temporary and circular in character, facilitated by the free movement regime within the EU. This is in line with the growing importance of return migration, since the labour markets in the sending countries of East-West migration offer increasing job opportunities (Cassarino 2004; Dustmann, Bentolila, Faini 1996; Ghosh 2001). With recovering economies in the home countries and growing migration costs in the countries of destination, returning home is an option for at least some of the East-West migrants. It is also likely that one of the consequences of the economic crisis was more-intense circular migration amongst EU15 and EU8+2 countries. According to Grabowska-Lusińska (2010), even those who choose to return to Poland for good do not rule out further short-term emigration. Indeed, it has been observed that Polish returnees, after spending some time back in Poland, re-emigrate – often to the country of the first emigration (Barcevičius, Iglicka, Repečkaitė, Žvalionytė 2012: 8).
CEE migrants in Austria
Inflow and outflow
Turning to the Austrian situation and focusing on the ten countries that are primarily of interest, the cumulative migration balances with both EU8 and EU2 countries were always positive between 2002 and 2013, with the inflows always being higher than the outflows (see Figure 2). The year 2004 marked a first peak of the inflow overhang; in 2005 a regressive trend started that lasted until 2010. As of 2011, a new take-off phase began, easily explained by the termination of transitional rules for the EU8 countries. From 2011 onwards, Austria guaranteed free access to the labour market for EU8 citizens and, from the beginning of 2014, for citizens from Romania and Bulgaria.
Figure 2. Inflows and outflows from EU8 and EU2 in 2002–2013
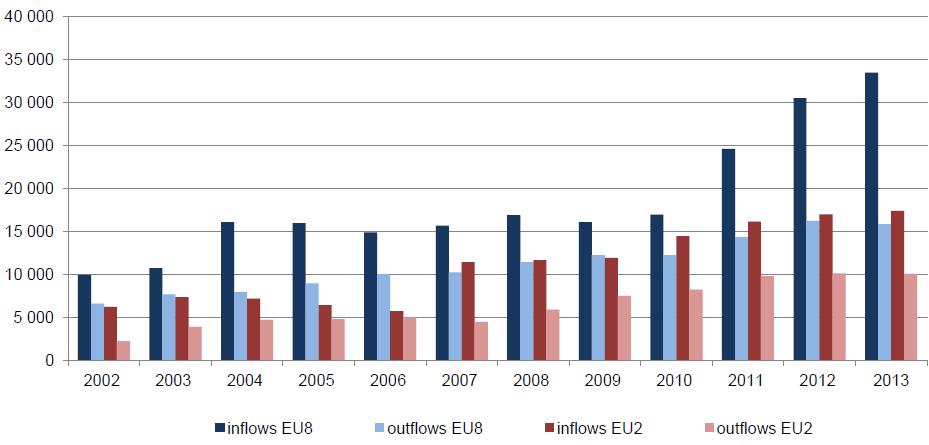
Source: Statistics Austria, own design.
The ten countries under consideration show widely varying inflows and outflows in the years from 2002 until 2012. For some of these countries, Austria is an extremely attractive destination, with its existing networks and geographical proximity whilst, for others, it is not an option in terms of migration, mostly due to greater distances, other more attractive destinations or a generally lower level of emigration. Overall, 309 000 persons born in one of the ten CEECs entered Austria between 2002 and 2012, and 192 000 left.3
Though migration relations between Austria and Romania are comparatively new, Austria is the country with the highest cumulative inflow between 2002 and 2012 (92 300 persons) and displaying the highest positive migration balance (38 700). It is followed by Poland, Hungary and Slovakia, countries that share a long migration history with Austria, and the Vienna region in particular (see Table 3). Flow data prove that – at least up to now – Austria has not been an important destination for people from the Baltic countries or Slovenia.
Romania entered the EU in 2007, which is clearly reflected in the flow data. Until 2006, Romanians were, legally, third-country nationals and the number of persons registering in Austria remained at around only 5 000 persons per year. As from 2007 we see a pronounced rise, with 9 000 entries by 2009 and a peak of 13 400 entries in 2012. Outflows remained considerably lower, resulting in a pronounced positive net migration.
Table 3. Inflows, outflows and net migration of persons born in CEECs from and to Austria, 2002–2012 cumulative
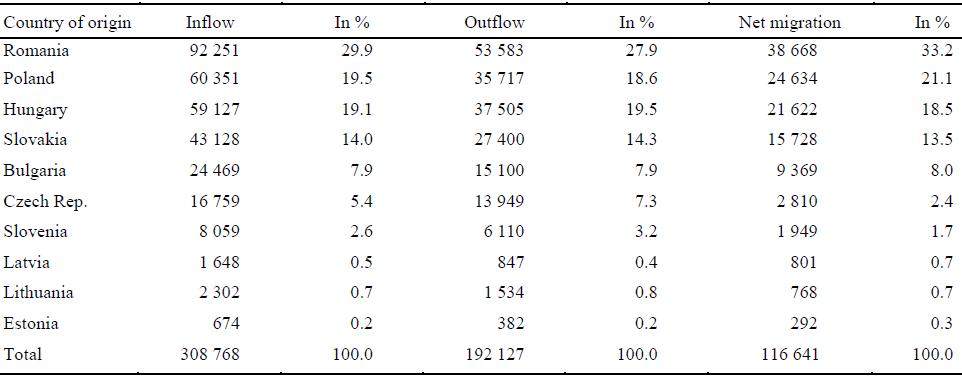
Source: Statistics Austria, Population Register. Sorted descending by net migration.
In the case of Hungary, the balance has seen almost continual growth (with the exception of 2006), and reached an interim peak in 2011 (the year in which the transitional rules were abolished), with 9 638 persons registering in Austria, the highest number for all countries under consideration and for all points in time. The trend is not as clear for Poland. From 2004 until 2009 the balance diminished and was near zero by 2009; however, it then improved and reached 6 907 persons in 2011. The migration balance for Slovakia fluctuated constantly between 2002 and 2011. Inflow grew in 2011, as did outflow, though at a lower level. Finally, official migration from the Czech Republic to Austria was very stable in the previous decade, at a very low level, with about 1 200 people entering and around 1 000 Czechs leaving Austria every year.
Population stock
Table 4 again focuses on the ten countries that are of interest in this analysis. In total, 295 500 persons who were born in a CEEC are currently officially registered in Austria; their total number has grown by 41 per cent since 2002. A quarter emigrated from Romania, with Poles second in quantitative terms, making up more than a fifth. Hungary (16.3 per cent) and the Czech Republic (14.1 per cent) are third and fourth in this ‘ranking’ of 2013. However, not all groups have been growing in quantitative terms between 2002 and 2013: the number of Czechs and Slovenians fell over the previous decade, a consequence of the mortality of the population born in the Czech Republic and Slovenia and expelled after World War II. Furthermore, Table 4 proves that immigration from the Baltic States is more or less irrelevant in the case of Austria.
Accession of the CEECs to the EU in 2004 as such did not immediately leave a significant trace in the development because regulations still existed which reduced the free admission of labour from Eastern-European EU countries into Austria. The number of gainfully employed CEE citizens has been growing since 2000. Before the EU accession of CEECs (and for citizens of new EU member-states for as long as the transition regulations still applied), one way of gaining access to the labour market was through seasonal work, predominantly in tourism and harvesting.
Table 4. Austrian population born in CEECs in 2002 and 2013
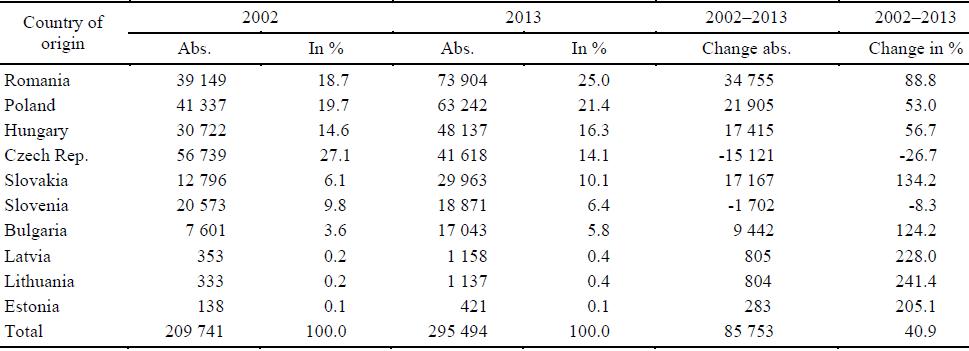
Source: Statistics Austria, Population Register; own calculation.
Statistics from the Federation of Austrian Social Insurance Institutions mirror the situation on the Austrian labour market in the two years following abolition of the transitional labour market restrictions. Thus, the number of legally employed Hungarians increased extremely quickly over the two years from March 2011 (28 219) to March 2013 (55 327) and they are now the second largest group of migrants (after Germans) on the Austrian labour market. During the same period the employment of Slovakians almost doubled (from 11 203 to 22 461). The number of Poles grew from 18 060 to 26 694 whilst, in the Czech case, the increase was rather more modest – from 9 033 to 12 200. There is virtually no displacement of the Austrian workforce by this inflow but, instead, the replacement of a poorly qualified foreign labour force by better-qualified CEE citizens.
The emergence of transnational labour markets: Austria and its neighbours
The fast-growing influx after transitional rules ended clearly demonstrates how flexible the workers from the neighbouring countries are. They make their decision to migrate based on the costs and gains of mobility and are able to re-orientate their destination countries within a short period of time.4 Most striking is the importance of distance and of neighbouring countries for the regional distribution of EU8 and EU2 migrants in Austria. For all CEE migrants, Vienna and its urban region is the most important target, though in differing proportions – a distribution that can be easily explained by the geographical distance and the possibility of commuting from the neighbouring countries of Hungary, Slovakia and the Czech Republic. The capital of Slovakia is adjacent to the Austrian-Slovakian border. The construction of a motorway to connect the two capitals was completed in recent years. From city limit to city limit, in reasonable traffic, the journey takes 45 minutes. Both are Schengen countries and thus the border control was abolished after the accession of Slovakia to the EU. However, commuters and short-term migrants do not exclusively originate from the Bratislava region, which is – compared to other Slovakian regions – a relatively high-wage region. The catchment area of near-border mobility includes the poorer regions in the east of Slovakia (cf. Kahanec, Kureková 2014: 7) as well as the western part of Hungary.
Map 1 illustrates the distribution of EU8+2 citizens in Austria as a percentage of the population in each municipality. There is, in general, a high concentration in the enlarged Viennese urban area and some further spots of high concentration in other municipalities, mainly linked to job opportunities in tourism, agriculture, forestry and specific health resorts. Geographical distance to the regions of origin of these EU8+2 citizens seems to be an important factor. In addition to the foreign resident population, commuters from the neighbouring countries strengthen these transnational relations. Migration from Austria’s neighbouring countries still has a largely temporary and circular component. The migrants are reacting to unemployment or low pay, and to the lack of job opportunities in their country of origin, by a quick return home, where the costs of living are (still) substantially lower (Okólski 2012b: 35).5 Furthermore there is empirical evidence, at least for Polish migrants, that the circular pattern has become more diversified since 2007, with an increasing share settling down in their destination country (Kaczmarczyk 2014).
Map 1. Share of EU8+2 citizens in the total population in Austria on the municipal level in 2011
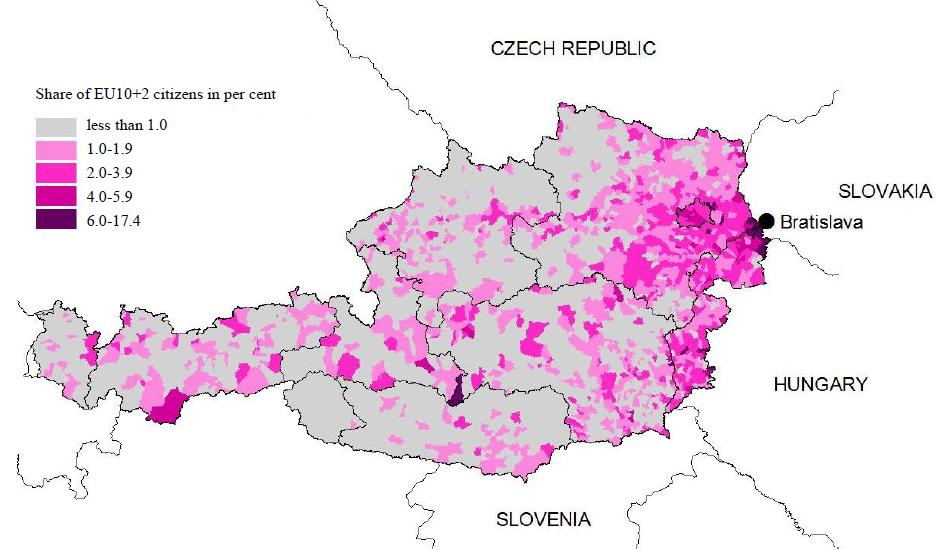
Source: Statistics Austria, Register based Census; own calculation and design.
The emergence of a transnational labour market has been evident over the last decade, but it includes more than migrants and commuters. Some of the Austrian villages in the east are now, essentially, suburbs of Bratislava due to cheap land prices and good accessibility. In recent decades the urban area around Vienna has expanded significantly to the south, and it is now realistic to assume that the east–west axis will be the decisive direction for future settlement.
Basic socio-demographic features of CEE migrants in Austria
Sex and age
In the early phase, when immigration from CEECs re-emerged, labour migrants were – typically, for new migration flows – young, male and well-educated (Fassmann, Hintermann 1997; Fassmann, Kollar 1996). Thus, in 1991, when immigration from CEECs began in greater numbers, the demographic selectivity of the labour force coming to Austria was rather pronounced (cf. Fassmann, Hintermann, Kohlbacher, Reeger 1999). The majority of east-west migrants was made up of young, economically active males who were more often willing to take on migration-related risks, as they were usually ‘footloose and fancy-free.’ In 1991 the proportion of male migrants amongst all CEE migrants was around 70 per cent, with only a limited margin of variation between the individual sending countries. At the same time, they were very young, with around one third and – in the case of the Czech and Slovak Federal Republic – even 43 per cent under 30 years old (for Polish migration, cf. Kaczmarczyk 2014: 129).
The gender composition has changed dramatically since the fall of the Iron Curtain, female migrants from the CEECs (over 15 years old) becoming more prevalent and today clearly outnumbering males in almost all age groups. Women from CEECs can very often be found in all sub-segments of the service sector, such as in private households, in child- as well as elderly-care (cf. Kahanec, Kureková 2014: 13). These are fields of occupation where demand is strong in Austria, thus providing a considerable numbers of jobs, but generally subject to modest incomes and often organised on an informal basis.
The current age structure of CEE migrants demonstrates a concentration in the age groups relevant to the labour market. Around 45.2 per cent of the population born in the EU8 and 60.6 per cent born in the EU2 are in the age group 15–44 years. The proportion of the under 15-year-old population is significantly below the Austrian average. The high proportion of elderly people, not typical for labour migration, must be mentioned – the majority of them born in one of the countries of the EU8 were from the Czech Republic. The figures reflect migrations to Austria that date back to the post-war period: displaced persons from the Sudeten region and asylum-seekers during the time of the so-called Prague Spring (see Enengel, Fassmann, Kohlbacher, Reeger 2014).
Table 5. Age of persons born in CEECs and in Austria in 2014
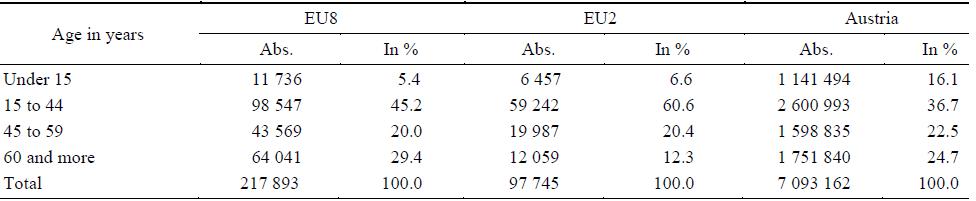
Source: Statistics Austria, Population register; own calculation.
Education
An important characteristic of East-West migration affecting guestworker migration from the former Yugoslavia and Turkey of the 1960s and 1970s is the above-average level of education of many more recent immigrants (Fassmann et al. 1999; Fassmann, Kohlbacher, Reeger 2004) which has made brain drain an integral part of this migration stream since 1989 (Iredale 2001). The majority of the guestworkers from Turkey and the former Yugoslavia were often educated only to primary-school level, and some were illiterate. The proportion of secondary academic school graduates was almost negligible.
In contrast to the guestworker migration, the new East-West migration is characterised by a high level of formal and occupational qualifications (Kaczmarczyk 2014: 133). The statistics show that the share of migrants from EU10 and EU2 countries with a tertiary education is higher than that of the Austrian-born population (cf. also Kahanec, Kureková 2014: 15). Slightly over 17 per cent of EU106 immigrants finish tertiary education (see Table 6). On the other hand, however, almost one in three immigrants born in Romania or Bulgaria has only primary-school education compared to the Austrian-born at 25.6 per cent (cf. Enengel et al. 2014).
Table 6. Educational level of persons born in Austria, the EU10 and EU2, aged 15 and older in 2011
Source: Statistics Austria, Register-based Census 2011; own calculation.
The educational profile of CEEC migrants was, and remains, markedly higher than the Austrian average. This fact continues to contrast with how migrants, in particular women, from CEECs often accept downward mobility in terms of status and qualifications and often become trapped in particular de-skilling jobs and sectors, with low wages and few opportunities for upward mobility in the labour market (Kaczmarczyk 2014: 133; Lendvai 2010: 8). Favell (2008: 711) highlights the danger of the ambitious ‘New Europeans’… becoming a new Victorian servant class for a West European aristocracy of creative-class professionals and university-educated working mums. This may sound too drastic, but female migrants holding a teacher’s diploma or even a PhD and working in Austria in child or geriatric care is not an uncommon occurrence, though it is becoming less relevant in quantitative terms.
Qualifications and training obtained in Austria are key to gaining employment that correlates to the level of educational attainment acquired. The duration of stay and length of employment are other important factors when seeking adequate employment. In the medium-skill segment, over-qualification is fairly rare, particularly in the case of an apprenticeship education (Bock–Schappelwein, Bremberger, Hierländer, Huber, Knittler, Berger, Hofer, Miess, Strohner 2009). University graduates are more likely to work below their skill levels, especially if they have not graduated from an Austrian university. This is particularly true for those persons who migrate to Austria at a more mature age, say over 40 (Biffl 2011).
Occupational status
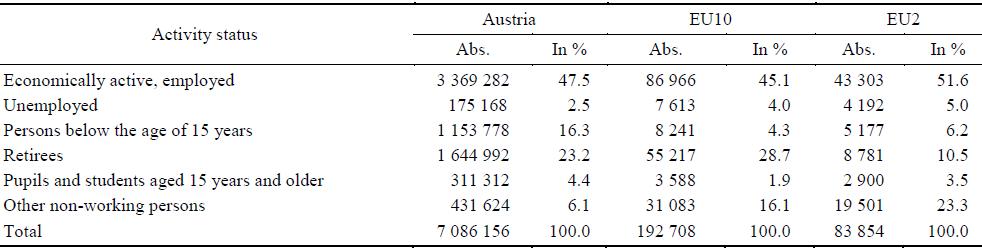
The current activity status of CEE migrants compared to the Austrian population allows an assessment to be made of important social groups, like the economically active, the unemployed, students, retirees and other non-economically active people (cf. Enengel et al. 2014). About 50 per cent of EU10 and 56 per cent of EU2 migrants are economically active, but have a higher share of unemployment than the Austrian-born population (unemployment rates: Austria – 4.9 per cent, EU10 – 8.0 per cent, EU2 – 8.8 per cent). Children, pupils and students as part of the non-economically active population are under-represented amongst CEE migrants. As a consequence of the definition of migrants as a foreign-born population that includes elderly people who migrated decades ago (e.g. from the Czech Republic), the share of retirees is higher among EU10 migrants (28.7 per cent) than among Austrians (23.2 per cent) and quite low for Romanians and Bulgarians (10.5 per cent).
An interesting group is that of ‘other non-working persons,’ which is made up of people aged 15 years and older who are either co-insured with another person, have an income from their own capital, or are not economically active due to other reasons (e.g. housewives). Of Romanians and Bulgarians, 23.3 per cent are part of this group and the share of EU10 migrants is also almost three times higher than in the Austrian population. Many of them probably form part of the informal labour market while being officially registered as part of the resident population.
Table 7. Activity status of persons born in Austria, EU10 and EU2 in 2011
Source: Statistics Austria, Register-based Census 2011; own calculation.
The analysis of the occupational status of East-West migrants on the Austrian labour market in the 1990s was clear: although their level of qualification was quite high – not only compared to other migrants but also to Austrian citizens – they only had limited access to the labour market in the lower segments (see Bauer 1996). High proportions of skilled, semi-skilled and unskilled workers and fewer opportunities to find white-collar positions painted an undoubtedly pessimistic picture. At the end of the 1990s we argued that de-qualification was the price which East-West migrants had to pay for access to the Austrian labour market (Fassmann et al. 1999). The widespread phenomenon of occupational de-qualification was empirically proven for the Austrian Polonia by Fassmann, Kohlbacher, Reeger (1995, 2004) and for East-West migration in general by Morocvasic (1994) and Morocvasic, de Tinguy (1993).
Table 8. Occupational positions of economically active CEE migrants and Austrians in 2011
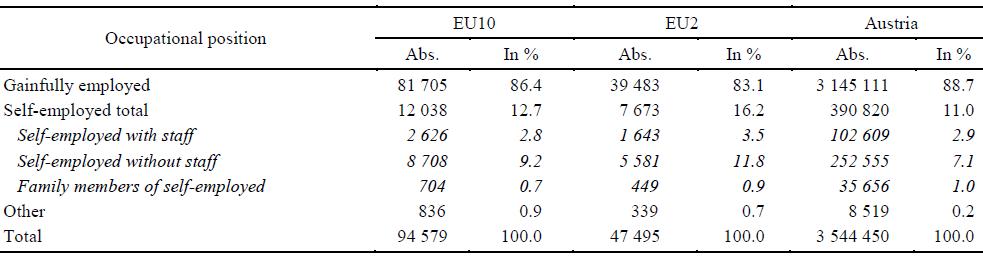
Source: Statistics Austria, Register-based Census 2011; own calculation.
Data for 2011 do not allow for a differentiation between white-collar and blue-collar positions, only for self-employed and gainfully employed persons, which nevertheless gives some interesting insights. We can see an enormous growth in self-employment between 2001 and 2011, with 27 per cent of Slovakians belonging to this segment and one in five migrants from Poland. Being self-employed does not play such an important role for Hungarians and migrants from the Czech Republic. This growth is a reaction to the transitional rules, which limited access to the labour market as a gainfully employed person and opened possibilities for the self-employed. However, the growth of self-employment can be seen as part of a convergence and normalisation process between the native and the foreign labour force. The significant de-qualification as the entrance fee to the labour market is increasingly replaced by a general allocation of jobs and job-seekers. The effect of being a CEE migrant for one’s position on the labour market disappears gradually.
However, there are some branches where EU8 or EU2 migrants can be found to a significantly higher or lower degree. The construction sector has to be mentioned as one such branch featuring a higher share of East-West migrants, as well as accommodation and food services, administration and support services. On the other hand, public services like education or public administration and defence are occupied to a higher degree by the native population. Once again, the high concentration of the East-West migrants in some exclusive niches can still not be observed, even two decades after the fall of the Iron Curtain.
Table 9. Employment by ÖNACE of the workplace, persons born in Austria, EU10 and EU2, in 2011
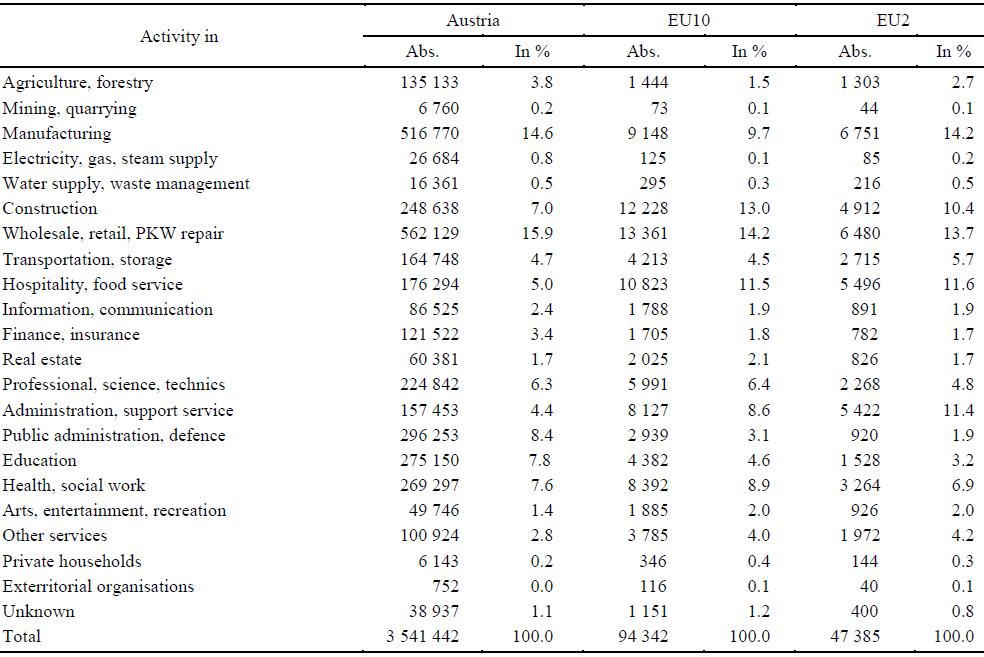
Source: Statistics Austria, Register-based Census 2011; own calculation.
The informal dimension
The picture thus far only provides information on persons working in Austria on a legal, official basis. Relatively little is known about the structures and actual amount of illegal employment of CEE nationals in Europe in general (Cyrus 2008) and in Austria specifically (Biffl 2011; Fassmann, Kollar 1996; Fassmann et al. 1995, 2004). Kraler, Reichel, Hollomey (2008: 53) stated that on the basis of the available evidence, no serious quantification of irregular migration in Austria is possible. Sometimes researchers or political officials made estimates about the extent of and numbers in irregular employment, but these have always been very vague (for example, Grzezgorzewska-Mischka 1995; Sauberer 1991; Walterskirchen, Dietz 1998). Biffl (2002: 360) spoke of 47 000 foreigners working in the informal sector and based her approximation on the assumption that the share of foreigners in the informal sector is about 10 per cent of overall employment. Jandl (2004), on the basis of data from the Inspectorate of Labour, criticised the unrealistically high estimates based on extrapolations. Enste and Schneider (2006) estimated that about 104 000 illegal foreign full-time workers were employed in 2005. Schneider (2006) estimated that 98 000 full-time-equivalent foreigners were working illegally in Austria. Jandl, Hollomey, Stepien (2007: 37), in their Delphi study, estimated the extent of irregular migrant work in Austria as a percentage of total employment to be highest in construction and in catering/tourism (around 15 per cent) and agriculture (13 per cent). Substantially lower was the average estimate for trade and industry (5.2 per cent). The estimated share of irregular migrant work in total employment in Austria came out at 5 per cent. The estimates on the absolute numbers of irregularly employed foreigners were around 29 000 in the care sector in private households and for cleaning in private households it was around 24 000. For the household sector, estimates at the high end were backed up with evidence from surveys on household expenditure, which allegedly indicated some 60 000 illegally employed household helpers.
Bearing in mind the short distances and thus the possibility of moving back and forth on a daily or weekly basis, as well as the income differentials on the one hand and the demand for cheap help in private households in Austria on the other, we can assume that there are many housekeepers, baby-sitters and (geriatric) nurses who find work. From the perspective of individual migrants, illegality is often seen as a temporary and passing state (even though it may last for several years). Migrants tend to ‘settle within mobility,’ staying mobile ‘as long as they can’ in order to improve or maintain the quality of life at home. This is especially true for care work in the household sector, to a large extent undertaken by persons from the new EU countries without the legally required steps of social-security-backed employment contracts. Reacting to this, parliament changed the legislation in 2007. These workers can now be legally employed under the terms of the ‘Private Household Workers Act’ or as self-employed nurses (see Adam 2007), another sign of a normalisation process. This materialised to a large extent in 2008, raising the employment of foreigners (salaried as well as self-employed) by some 20 000, and thereby contributing to the slow-down in measured productivity growth, which was a result of legalisation (Biffl 2011: 96).
Summary and outlook: the growing importance of intra-EU mobility
We started out with three main research questions. First we assumed that, with the fall of the Iron Curtain, the accessions of 2004 and 2007 and the phasing out of the transitional rules, a push-and-pull-driven migration pattern had become dominant. Second, we expected that, with the emergence of a legally harmonised and unified European migration space, geographical variables would become more and more important and lead to the emergence of transnational labour markets. And finally, we assumed a further focus of the new East-West migration. If the push-and-pull-driven migration has become the dominant form, we expect to see a clear focus on the labour-market-relevant attributes.
The first research question was clearly proven. The size of the migration from CEE countries to the EU15 increased from year to year. Throughout the observation period (2002–2011) the number of citizens living in one of the EU15 countries increased by nearly 400 per cent. This increase does not exactly hold true for every EU15 country (different starting positions and different legal frameworks), but a general tendency is clearly detectable. The EU8+2 countries became an important and closely linked periphery to the EU15 and a reservoir for a flexible and spatially mobile labour force. The observation made on the EU15 level is the same as that for Austria.
The second research question was also approved. We have illustrated with the Austrian example how quickly and how clearly a transnational labour market has emerged. The distance between sending regions and economically prosperous receiving regions became much more important. Asymmetric labour markets cut off by different legal systems disappeared gradually and have now been replaced by labour markets where the costs for migration or pendular mobility and the wage gain are the decisive factors.
Finally, we analysed the stock of migrants from the EU8 and EU2 countries in Austria and compared it to stock data from a decade earlier. We observed a growing importance of the peak working age, a convergence of the employment status and a more uniform distribution of the sectors in which EU8 and EU2 migrants are employed. In the construction, accommodation and food-service sectors, and in administration and support services, the share of new East-West migrants is higher; however, when compared to the distribution one or two decades ago, a ‘normalisation process’ can be observed.
Notes
1 In this article we refer to the 10 sending countries to be analysed (in alphabetical order, Bulgaria, Czech Republic, Estonia, Hungary, Latvia, Lithuania, Poland, Romania, Slovakia, Slovenia) either as CEECs (Central Eastern European Countries) or as EU8 (accession countries of 2004 without Cyprus and Malta) and EU2 (Romania and Bulgaria).
2 It is apparent that a mass return migration of CEEC nationals did not occur during the economic recession of 2009–2011 (see Holland, Fic, Rincon–Aznar, Stokes, Paluchowshi 2011: 35; Koehler, Laczko, Aghazarm, Schad 2010: 24). However, it is a fact that new migration from Poland to the UK and Ireland, for example, has fallen sharply (Krings, Bobek, Moriarty, Salamonska, Wickham 2009; Ratha, Mohapatra, Silwal 2009: 5). Many migrants chose a wait-and-see strategy before returning. Thus, the financial crisis resulted in a slight freezing of both emigration and return migration, rather than in a pronounced intensification of returns. What, in the case of Poland, was taken as a sign of a large-scale return migration appears to have been an ‘overestimate’ (Iglicka 2010).
3 It is important to keep in mind that an individual can be included more than once, as people can go back and forth a good deal in 11 years. The present statistics do not allow for tracing back individuals who are included more than once.
4 When Austria – as well as Germany – set up their transitional rules, many experts criticised the decision, arguing that the migration linkages are cut down for a long time and that the ‘best and brightest’ migrants would be lost because they went to the UK and Ireland. The dynamic of the re-orientation of the migration pattern shows these predictions to be false. The UK and Ireland lost their attractiveness when Austria and Germany opened their labour markets.
5 It can be shaped by the term ‘liquid migration,’ which means that the transformation of institutions and the enhancement of individualisation processes promote all forms of temporary migration (Engbersen 2012; Engbersen, Snel, de Boom 2010).
6 Data from the register-based census of 2011 are only available for the EU10, including Cyprus and Malta. As the number of persons from these two countries (persons born in Cyprus: 296 and in Malta: 101) in 2014 in Austria is very small, the outcomes are not biased.
References
Adam G. (2007). New Law Sanctions Private Care Services by Foreign Nationals. European Industrial Relations Observatory. Online: http://www.eurofound.europa.eu/eiro/2007/09/articles/AT0709019I.htm (accessed: 31 December 2014).
Barcevičius E., Iglicka K., Repečkaitė D., Žvalionytė D. (2012). Labour Mobility Within the EU: The Impact of Return Migration. Dublin: Eurofound.
Bauer A. (1996). Volkszählung 1991: Berufstätigkeit von Ausländern und Ausländerinnen. Statistische Nachrichten 51(6): 417–425.
Bauer T., Zimmermann K. (1999). Assessment of Possible Migration Pressure and its Labour Market Impact Following EU Enlargement to Central and Eastern Europe. A Study for the Department for Education and Employment. Bonn: University of Bonn, Institute for the Study of Labour.
Biffl G. (2002). Arbeitsmarktrelevante Effekte der Ausländerintegration in Österreich. Studie des Österreichischen Instituts für Wirtschaftsforschung. Vienna: WIFO.
Biffl G. (2011). Migration and Labour Integration in Austria: SOPEMI Report on Labour Migration, Austria 2010–11. Krems: OECD.
Bock–Schappelwein J., Bremberger C., Hierländer R., Huber P., Knittler K., Berger J., Hofer H., Miess M., Strohner L. (2009). Die ökonomischen Wirkungen der Immigration in Österreich 1989–2007. Vienna: WIFO,.
Borchers K., Breustedt W. (2008). Die Datenlage im Bereich der internationalen Migration. Europa und seine Nachbarregionen. Working Paper 18. Nuremberg: Bundesamt für Migration und Flüchtlinge. Online: http://www.bamf.de/SharedDocs/Anlagen/DE/Publikationen/WorkingPapers/wp1... (accessed: 24 November 2014).
Braun G., Topan A. (1998). Internationale Migration. Ihre Folgen für die Ursprungsländer und Ansätze eines Migrationsregimes. Konrad-Adenauer-Stiftung, Interne Studie 153. Sankt Augustin.
Cassarino J.-P. (2004). Theorising Return Migration: The Conceptual Approach to Return Migrants Revisited. International Journal on Multicultural Societies 6(2): 253–279.
Cyrus N. (2008). Being Illegal in Europe: Strategies and Policies for Fairer Treatment of Migrant Domestic Workers, in: H. Lutz (ed.), Migration and Domestic Work. A European Perspective in a Global Theme, pp. 177–194. Aldershot: Ashgate.
de Haas H. (2008). Migration and Development. A Theoretical Perspective. IMI Working Paper 9. Oxford: University of Oxford, International Migration Institute. Online: http://www.imi.ox.ac.uk/pdfs/wp/WP9%20Migration%20and%20development%20th... (accessed: 31 December 2014).
Dustmann C., Bentolila S., Faini R. (1996). Return Migration: The European Experience. Economic Policy 11(22): 213–250.
Enengel M. L., Fassmann H., Kohlbacher J., Reeger U. (2014). Mapping and Analysis of Types of Migration from CEE Countries: Country Report Austria. IMAGINATION Working Paper 1. Vienna: Austrian Academy of Sciences.
Engbersen G. (2012). Migration Transitions in an Era of Liquid Migration, in: M. Okólski (ed.), European Immigrations. Trends, Structures and Policy Implications, pp. 91–107. Amsterdam: Amsterdam University Press.
Engbersen G., Snel E., de Boom J. (2010). ‘A Van Full of Poles’: Liquid Migration from Central and Eastern Europe, in: R. Black, G. Engbersen, M. Okólski, C. Pantiru (eds), A Continent Moving West? EU Enlargement and Labour Migration from Central and Eastern Europe, pp. 115–141. Amsterdam: Amsterdam University Press.
Enste D., Schneider F. (2006). Schattenwirtschaft und irreguläre Beschäftigung: Irrtümer, Zusammenhänge und Lösungen. Online: http://www.economics.jku.at/members/Schneider/files/publications/Schatte... (accessed: 31 December 2014).
Fassmann H. (2011). Konzepte der (geographischen) Migrations- und Integrationsforschung, in: H. Fassmann, J. Dahlvik (eds), Migrations- und Integrationsforschung: multidisziplinäre Perspektiven, pp. 61–93. Vienna: Vienna University Press.
Fassmann H., Hintermann C. (1997). Migrationspotential Ostmitteleuropa. Struktur und Motivation potentieller Migranten aus Polen, der Slowakei, Tschechien und Ungarn. ISR-Forschungsberichte 15. Vienna: Austrian Academy of Sciences Press.
Fassmann H., Hintermann C., Kohlbacher J., Reeger U. (1999). ‘Arbeitsmarkt Mitteleuropa’. Die Rückkehr historischer Migrationsmuster. ISR-Forschungsberichte 18. Vienna Austrian Academy of Sciences Pres.
Fassmann H., Kohlbacher J., Reeger U. (1995). Die ‘neue’ Zuwanderung aus Ostmitteleuropa: Eine empirische Analyse am Beispiel der Polen in Österreich. ISR-Forschungsberichte 13. Vienna: Austrian Academy of Sciences Press.
Fassmann H., Kohlbacher J., Reeger U. (2004). Polen in Wien. Entwicklung, Strukturmerkmale und Interaktionsmuster. ISR-Forschungsberichte 30. Vienna: Austrian Academy of Sciences Press.
Fassmann H., Kollar D. (1996). Les migrations frontalières entre la Slovaquie et l'Autriche. Migrations Societé 8(43): 91–102.
Fassmann H., Reeger U. (2012). ‘Old’ Immigration Countries in Europe, in: M. Okólski (ed.), European Immigrations. Trends, Structures and Policy Implications, pp. 65–90. Amsterdam: Amsterdam University Press.
Fassmann H., Reeger U., Sievers W. (eds) (2009). Statistics and Reality: Concepts and Measurements of Migration in Europe. Amsterdam: Amsterdam University Press.
Favell A. (2008). The New Face of East-West Migration in Europe. Journal for Ethnic and Migration Studies 34(5): 701–716.
Fields G. S. (1991). Place-to-Place Migration: Some New Evidence. The Review of Economics and Statistics 61(1): 21–32.
Ghosh B. (ed.) (2001). Return Migration: Journey of Hope or Despair? Geneva: International Organisation for Migration.
Grabowska-Lusińska I. (ed.) (2010). Poakcesyjne powroty Polakow. CMR Working Paper 43/101. Warsaw: University of Warsaw, Centre of Migration Research.
Grzegorzewska-Mischka E. (1995). Die polnische Emigration in den 80er Jahren und ihre demographische Struktur, in: H. Fassmann, J. Kohlbacher, U. Reeger (eds), Die ‘neue’ Zuwanderung aus Ostmitteleuropa: Eine empirische Analyse am Beispiel der Polen in Österreich, pp. 63–68. ISR-Forschungsberichte 13. Vienna: Austrian Academy of Sciences Press.
Hagen-Zanker J. (2008). Why Do People Migrate? A Review of the Theoretical Literature. MPRA Paper 28197. Munich: University of Munich. Online: http://www.fse.usj.edu.lb/2013-2014/cours%20macrodynamique%20du%20march%... (accessed: 20 November 2014).
Holland D., Fic T., Rincon–Aznar A., Stokes L., Paluchowski P. (2011). Labour Mobility Within the EU: The Impact of Enlargement and the Functioning of the Transitional Arrangements. London: National Institute of Economic and Social Research for the European Commission, Employment, Social Affairs and Inclusion Directorate General.
Iglicka K. (2010). Powroty Polaków po 2004 roku: Wyniki badania ilościowego Warsaw: Biuletyn Naukowy Rzecznika Praw Obywatelskich 69.
Iredale R. (2001). The Migration of Professionals: Theories and Typologies. International Migration Review 39(5): 7–24.
Jandl M. (2004). The Estimation of Illegal Migration in Europe. Migration Studies 41(153): 141–155.
Jandl M., Hollomey C., Stepien A. (2007). Migration and Irregular Work in Austria: Results of a Delphi-Study. International Migration Papers 90. Geneva: International Labour Organisation.
Kaczmarczyk P. (2014). EU Enlargement and Intra-EU Mobility: Lessons to Be Drawn from the Post-2004 Migration of Poles, in: P. Kaczmarczyk, M. Barslund, M. Busse, C. Vargas–Silva, T. Baas, M. Izquierdo Peinado, J. F. Jimeno, A. Lacuesta, B. Galgóczi, J. Leschke (eds), Forum: Labour Mobility in the EU: Dynamics, Patterns and Policies, pp. 128–136. Intereconomics: Review of European Economic Policy 49(3): 116–158.
Kahanec M., Kureková L. M. (2014). Did Post-Enlargement Labor Mobility Help the EU to Adjust During the Great Recession? The Case of Slovakia. IZA Discussion Paper 8249. Bonn: Institute for the Study of Labour.
Kahanec M., Pytliková M., Zimmermann K. F. (2014). The Free Movement of Workers in an Enlarged European Union: Institutional Underpinnings of Economic Adjustment. IZA Discussion Paper 8456. Bonn: Institute for the Study of Labour.
Koehler J., Laczko F., Aghazarm C., Schad J. (2010). Migration and the Economic Crisis in the European Union: Implications for Policy. Geneva: International Organisation for Migration.
Kraler A., Reichel D., Hollomey C. (2008). Undocumented Migration in Austria. Clandestino Research Brief. Athens: ELIAMEP. Online: http://www.eliamep.gr/en/category/migration/ (accessed: 31 December 2014).
Krings T., Bobek A., Moriarty E., Salamonska J., Wickham J. (2009). Migration and Recession: Polish Migrants in Post-Celtic Tiger Ireland. Sociological Research Online: http://www.socresonline.org.uk/14/2/9.html (accessed: 1 January 2014).
Lee E. S. (1966). A Theory of Migration. Demography 3(1): 47–57.
Lendvai N. (2010). Ties and Ruptures: Welfare States and Migration in Central and Eastern Europe. EUI-Working Papers, MWP-2010/09. San Domenico di Fiesole: European University Institute.
Morocvasic M. (1994). Pendeln statt Auswandern. Das Beispiel der Polen, in: M. Morocvasic, H. Rudolph (eds), Wanderungsraum Europa. Menschen und Grenzen in Bewegung, pp. 166–187. Berlin: Sigma.
Morocvasic M., de Tinguy, A. (1993). Between East and West: A New Migratory Space, in: H. Rudolph, M. Morocvasic (eds), Bridging States and Markets. International Migration in the Early 1990s, pp. 245–263. Berlin: Sigma.
Müller-Mahn D. (1999). Migrationskorridore und transnationale soziale Räume. Eine empirische Skizze zur Süd-Nord-Migration am Beispiel ägyptischer ‘sans-papiers,’ in Paris, in: J. Janzen (ed.), Räumliche Mobilität und Existenzsicherung, pp. 167–200. Berlin: Gebr. Mann Verlag.
Okólski M. (ed.) (2012a). European Immigrations. Trends, Structures and Policy Implications. Amsterdam: Amsterdam University Press.
Okólski M. (2012b). Transition from Emigration to Immigration: Is It the Destiny of Modern European Countries? in: M. Okólski (ed.), European Immigrations. Trends, Structures and Policy Implications, pp. 23–44. Amsterdam: Amsterdam University Press.
Parnreiter C. (2000). Theorien und Forschungsansätze zu Migration, in: K. Husa, C. Parnreiter, I. Stacher (eds), Internationale Migration. Die globale Herausforderung des 21. Jahrhunderts?, pp. 25–52, Frankfurt am Main: Brandes and Apsel.
Pytliková M. (2006). Where Did Central and Eastern European Emigrants Go and Why? Aarhus: University of Aarhus, School of Business, CIM and Department of Economics. Online: http://pure.au.dk//portal/files/482/6_phdchap4_MP.pdf (accessed: 31 December 2014).
Ratha D., Mohapatra S., Silwal A. (2009). Migration and Remittance Trends 2009. Migration and Development Brief 11. Washington: World Bank.
Reniers, G. (1999). On the History and Selectivity of Turkish and Moroccan Migration to Belgium. International Migration 37(4): 679–713.
Sauberer M. (1991). Zusätzliche Arbeitskräfte für die Ostregion: Migration und Pendelwanderung, in: Österreichische Raumordnungskonferenz (ed.), Offene Grenzen: Neue Aufgaben für die Regionalpolitik, pp. 33–38. Vienna: ÖROK.
Schneider F. (2006). Nur noch leicht sinkende Schattenwirtschaft in Deutschland im Gegensatz zu anderen OECD-Ländern im Jahr 2006: Fluch oder Segen? Linz: Universität Linz.
Strzelecki P., Wyszynski R. (2011). Potential Implications of Labour Market Opening in Germany and Austria on Emigration from Poland. MPRA Paper 32586. Munich: University of Munich. Online: http://mpra.ub.uni-muenchen.de/32586/ (accessed: 19 November 2014).
Walterskirchen E., Dietz R. (1998). Auswirkungen der EU-Osterweiterung auf den österreichischen Arbeitsmarkt. Vienna WIFO.
Westmore B. (2014). International Migration: The Relationship with Economic and Policy Factors in the Home and Destination Country, OECD Economics Department Working Papers No. 1140, http://dx.doi.org/10.1787/5jz123h8nd7l-en (accessed: 19 November 2014).
Zolberg A. R. (1989). Migration Theory for a Changing World. International Migration Review 23(3): 403–430.